Beyond Business Intelligence
Predictive Science for Today's Bottom Line
Beyond Business Intelligence
Predictive Science for Today's Bottom Line
After the companys overall risk has been assessed along with the risk contributions from each of the principal risk categories, management will want to assess the performance of each of its business segments. The relative profitability of different business segments could be gauged from the RAROC estimates calculated for each segment.
The authors believe that individual business return performance should be based on stand-alone RAROC rather than providing an allocated diversification benefit to each business. We believe that any benefit that accrues to a business activity resulting from the companys portfolio structure should be credited to a general corporate account rather than to the individual business activity that had nothing to do with creating the benefit.
LOB RAROC
ERM breaks the risk, capital, and RAROC for each business activity or LOB down into Reserve Risk and Underwriting Risk components. The benefit of breaking the LOB performance down into Reserve (past business) and Underwriting (new business) parts is that it allows management to evaluate the effectiveness of its pricing policy on past as well as future business. The total RAROC will not provide this information.
RAROC on the Reserve Risk represents the return for past business that has already been accepted and will include all the reserve strengthening that has occurred on that business to date:
Reserve RAROC = {PV(Duration matched interest on insurance reserves) + Interest on EC} / PV(EC )
where Economic Capital EC refers to the stand-alone risk of an LOB.
Underwriting Risk RAROC
Underwriting Risk RAROC represents the expected return that the company should obtain for the premium that it will collect in the next periodthe next 12 months. Management will want to input into the ERM model all of the risk factors that it believes may be experienced in the next period, i.e., premium rate increases or declines, premium volume, expense, economic, and investment rate factors, etc. In this way, management will learn what type of return it should expect to make in the next period given its current pricing strategy.
Underwriting RAROC = {PV(Premiums) - PV(Expected Losses) - PV(Expenses) + Interest on EC} / PV(EC )
where Premiums - to be collected in the next period; Expected Losses (Losses and ALAE)for all future periods while reserve is still active; Expense (ULAE and Overhead)for all future periods while reserve is still active.
Risks Omitted from this Case Study
It is important to say at the very beginning that this case study will not attempt to evaluate the risk capital that will be required to support Cargos operational or catastrophe risk (other than what has been captured in the last 10 years of the paid loss triangles). The principal purpose of this exercise is to reveal the dynamics of measuring integrated risk with those fields of information that are available to us on a robust basis from publicly available sources. This includes: interest rate risk, credit risk, foreign exchange, and insurance risk (non-catastrophe). Reliable figures on operational and catastrophe risk are not readily available from any source other than the company itself. Therefore, the economic capital assessments and allocations that are made in this exercise may appear low due to the omission of these two factors. Seaburys ERM engine does possess the ability to readily integrate and aggregate a companys operating risk and catastrophe distributions with that of the rest of its risk so that a total solution is realized. The principal issue that we are attempting to illustrate in this case study is how economic capital is impacted within an integrated framework, from a base case realization to that of various stress-tests.
Operational Risk Capital
The difficulty of quantifying operational risk is that there are no public databases that record and classify these events such as there are for most of the other categories of riskinterest rate risk, credit risk, paid losses, etc. As such, the first thing that any company will discover as it implements an integrated enterprise risk management system is that the economic capital requirement will often be significantly less than the companys actual capital level (nominal capital). The difference between companies nominal capital and economic capital should generally be attributed to three sources of risk: 1) Operational risk, 2) Catastrophe risk, and 3) Market Event risk.
We have identified catastrophe risk as well as what the grab-bag of operational risks may consist. Market events, and the capital required to support them, can be described as those events that occur in the market whose expectation may fall outside the models historical data parameters. For example, Seaburys ERM is parameterized with 10 years of data for both assets and liabilities for which we obtain annual updates. This means that Seaburys ERM utilizes historical probabilities of the events that have occurred over the last 10 years. The resulting VaR represents a companys risk given that events during this historical time period are as equally likely to occur over the next year as they were over any one of the previous 10 years.
Should we assume that Cargo has sufficient capital if its nominal capital exceeds its economic capital? To answer this, we would have to ask ourselves if the financial and insurance markets might experience an event during the next year that was without precedent in the last 10 years. If so, we would want to include a scenario that reflected the potential for that event; be it a market movement like that of October of 1987, the Asian Crisis of 1997, or the equity market crash of 2001. This is why we create scenario analysis and stress-tests. This is also why companies nominal capital will generally exceed, by some significant margin, their economic capital requirements as measured within an ERM context. The drafters of risk-based capital for such regulatory initiatives as Basel II and Solvency II have debated and openly speculated as to which multiplier of the 99% VaR economic capital should be imposed on the insurance and the banking industries to account for this limitation. Since this risk parameter is unknowable, risk managers often prefer to implement scenario analysis and stress testing to arrive at their best estimate of required capital. For this exercise on Cargo, we are not including calculating the capital requirements for operational or catastrophe risk requirements, only that risk resulting from steady-state conditions and that risk resulting from various scenarios and market events.
Cargo's Risk
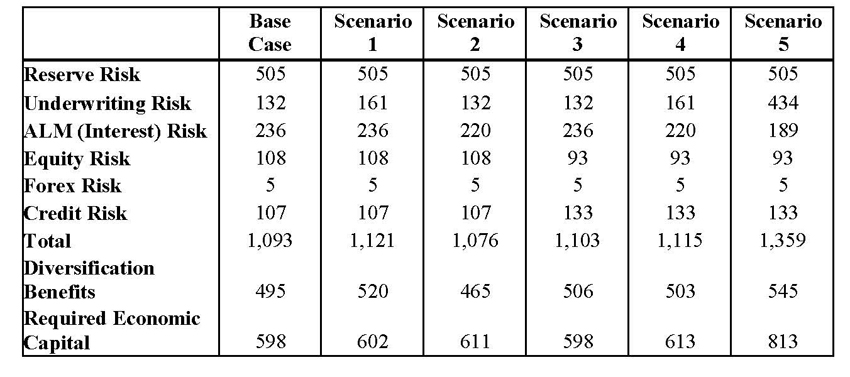
In table 1 below, we display the results of Cargos risks by category and scenario. Risks are displayed in dollars (millions).
Table 1
To be able to make any assessments about the companys capital adequacy, we need to examine the companys expected year end surplus in comparison to its required level of capital at the 99% confidence level. We can observe this in Table 2 below.
Table 2
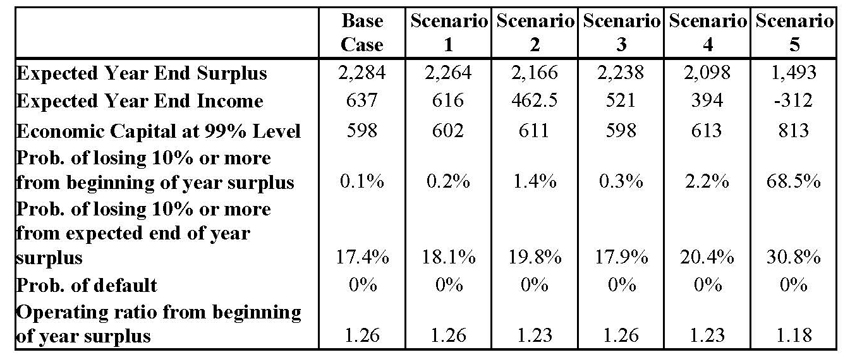
Table 2 reveals the impact of each scenario to several critical measures of economic capital and income. For the most part, it appears that Cargo has enough economic capital to sustain it through all of the scenarios although Scenario 5 has a serious impact. Table 2 includes some entries that have not yet been defined:
Expected Year End Surplus: This represents the amount of surplus that ERM predicts that Cargo will have at the end of the year and includes adjustments that result from: retained earnings (pre tax), capital gains/losses, unrealized gains/losses, and changes to reserves.
Expected Year End Income: This represents the earnings that ERM predicts Cargo will be able to recognize at year end and includes adjustments resulting from: capital gains/losses, unrealized gains/losses, and changes to reserves. Note: The definition of income in the ERM framework is equivalent to that of net worth (i.e., impact to surplus), not distributable earnings.
Probability of losing 10% or more from beginning-of-year/end-of-year surplus: This represents the probability that the company will lose at least 10% or more of its capital from its beginning-of- year/end-of-year surplus level. This is also known as the companys downside risk. ERM assesses this probability for any percent of the firms surplus.
Key insights from ERM analysis of Cargo:
What can the CEO of Cargo say to his board of directors about their companys overall risk and financial performance based on this analysis?
What the CEO actually says to his board will depend, in large part, on how large a probability his advisors will assign to Scenarios 4 and 5 since this is where both economic capital and earnings get hit the hardest. The CEO will have to review how significant an event it would be for Cargo to lose 20% of its capital since the probability of this occurrence increases to 45.4% in scenario 5. To be clear, the analysis is not saying that there is a 45.4% chance that Cargo will lose 20% or more of its capital, it is saying that this is only likely in the event of Scenario 5and Scenario 5 may only have a 5% chance of occurring. There is no way of attributing the likelihood of a market event unless that event is contained in the models data history. Assigning weights to low probability scenarios is beyond the scope of what an ERM system can provide if the events are not in the models historical parameters. However, an integrated ERM can provide the user with a good assessment of the likely impact if the event does occur.
Why are Scenarios and Stress Testing Important?
Stress testing is a process of identifying, often through Monte Carlo Simulations, the response of an asset or liability portfolio (or both), to a variety of types of financial distress. The purpose of the stress test is to evaluate how the organization whose portfolio is being tested would fare under a specific set of adverse market conditions. In the absence of being able to identify how many times 99% VaR capital should be imposed, risk managers will often identify specific market crises as being the events for which they want their institution to be prepared. These events, and their demonstrated ability to survive them without impairment, become a part of what they represent to the world as their statement of solidity. For this reason, ERM has been provided with a robust scenario generating capability. As a result, the ERM user can use an ERM system in two ways: 1) to observe their economic capital requirements at a desired level of VaR confidence assuming the business and economic climate does not deviate substantially from steady-state; or 2) the user can stress test market events that may have low expectations of occurrenceperhaps as low as once in 50 years for financial risk or once in 500 years for catastrophe risk. Many companies have found it useful to think in these terms rather than establishing a multiple of steady-state capital as the desirable level of capital to hold.
Cargos management team will want to run a large variety of single and stacked (simultaneous) scenarios that reflect their judgment about potential market events. They will then want to position their company to be able to withstand a level of risk that is in concert with their and the boards collective judgment about acceptable risk. To be able to do this, Cargo will need an integrated ERM that is fast enough to be able to provide results in real time and simple enough that complex risk interactions are revealed in easy-to-digest output. Cargos management may want to increase capitalization by about 36% if it wants to maintain the same downside risk probabilities in Scenario 5, as it currently enjoys in the Base Case. The countervailing judgment would have to be: how disadvantageous would this level of capitalization be to the companys current market competitiveness? This is the balance that management must strike.
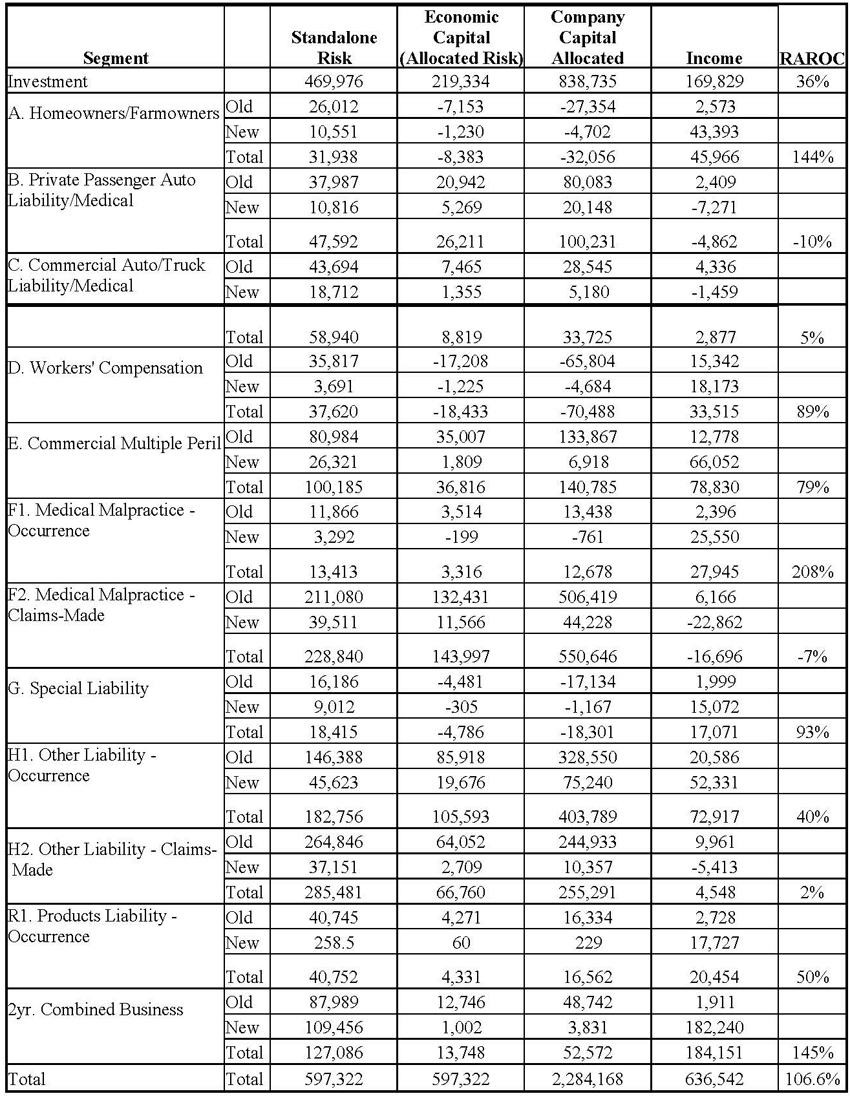
Capital Allocation and RAROC at Cargo
ERM allocates economic and stand-alone capital allocations to Cargos regulatory operating segments. Several lines require negative capital due to the diversification effect. Nominal capital has been allocated in proportion to that of Economic Capital and overhead has been allocated to each LOB in proportion to its premium volume (since specific overhead allocations are not available to the authors). RAROC for individual lines has been calculated based on stand-alone risk. Most of the individual segments appear to be making adequate RAROC values.
Table 3